

Your content is landing when nobody's home
The 5-step AI system for mapping your audience's cognitive seasons and publishing when attention is actually available to capture

Welcome to today’s edition of ROBOTS ATE MY HOMEWORK. Today we’re mapping your audience’s cognitive seasons, because Tuesday morning you is not the same person as Friday afternoon you.
In her 2003 Vassar commencement speech, Susan Sontag told graduates:
“Pay attention. It’s all about paying attention. Attention is vitality. It connects you with others. It makes you eager.”
Beautiful advice. And incomplete.
Sontag’s advice missed the creator’s perspective entirely. If you’re making content, you need to understand not just what your audience pays attention to, but also when they’re actually capable of paying attention in the first place.
The ancient Greeks had two words for time: chronos and kairos. Chronos is clock time, the relentless tick of seconds. Kairos is the right time, the opportune moments. Your content calendar worships chronos. Your audience lives in kairos.
Naturally, we need to solve this.
Here’s the plan:
Why your audience has cognitive seasons, and how to map them with AI;
The law enforcement concept that reveals how consistent posting schedules corrupt strategy;
A 5-step system for building timing intelligence that reads receptivity patterns instead of calendars
The two kinds of time
Sontag was talking to the people receiving content, telling them to pay attention, to stay eager and to connect.
If you’re creating content, though, you face a different challenge: understanding when your audience is actually capable of giving you their attention.
In ”The Garden of Forking Paths” by Borges, time branches infinitely at every moment. Your content exists in a similar garden: published once, but encountered in a thousand different psychological states. The person who reads your strategic framework on Tuesday morning with fresh coffee and an empty inbox is different from the person who encounters it Friday at 4 PM with a migraine and seventeen Slack messages bleeding red.
There are two different attention problems in content strategy. Most people obsess over the first and often ignore the second.
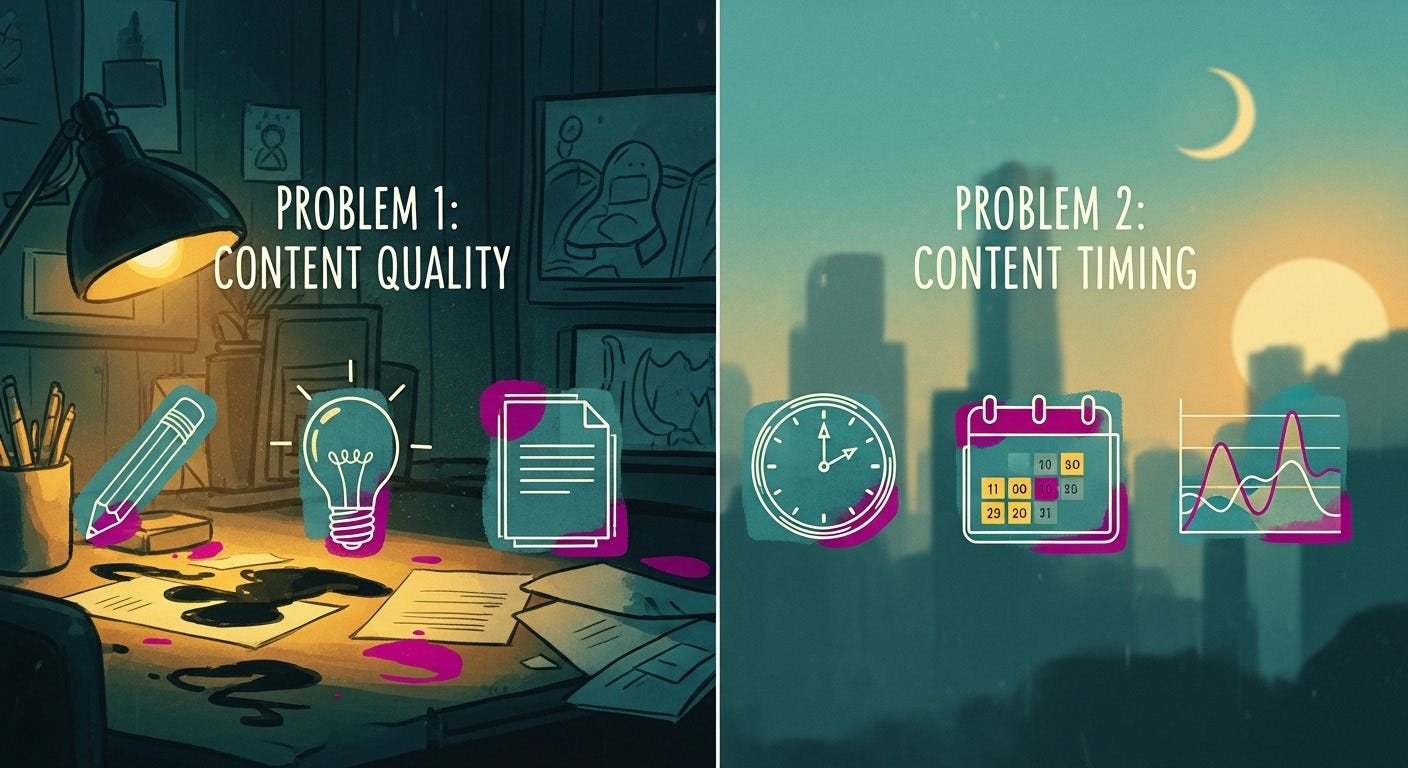
Problem 1: Making content worthy of attention. This is what everyone focuses on.
Problem 2: Publishing when attention is available to capture. Almost nobody thinks about this systematically.
Receptivity isn’t random. It follows patterns based on industry cycles (planning seasons versus execution seasons), cognitive load (beginning of work week versus Friday afternoon brain fog), and external context (news cycles, economic conditions, etc).
Good news is AI can help you identify these receptivity patterns systematically through analysis of your actual performance data.
Here’s a step by step:
Step 1: Building a content taxonomy
Before you can analyze timing patterns, you need to categorize your existing content library by type instead of topic.
Jorge Luis Borges imagined a Chinese encyclopedia that classified animals into categories like “belonging to the emperor,” “embalmed,” “trained,” “having just broken the vase,” and “drawn with a very fine camel hair brush.” The absurdity reveals something: all taxonomies are artificial, but some are more useful than others. You need one that maps to cognitive states, not content topics.
Create a multi-dimensional taxonomy:
Cognitive load: Quick tactical (can implement in 30 minutes) versus deep strategic (requires thinking time)
Intent: Educational versus inspirational versus promotional
Funnel stage: Awareness versus consideration versus decision
Format: How-to versus framework versus case study versus opinion
Let AI bulk-categorize your content library:
Step 1a: Export your content list with these columns: title, brief description, URL, platform. You can do this from your blog, LinkedIn, Substack, or a mix.
Step 1b: Feed your content list to Claude or GPT-4:
I’m building a content timing intelligence system. Bulk-categorize my historical content library across these 5 dimensions:

1. Cognitive Load: [Tactical / Strategic]
   - Tactical = Can implement in <30 min, step-by-step, actionable
   - Strategic = Requires thinking time, frameworks, planning, connecting dots

2. Intent: [Educational / Inspirational / Promotional]
   - Educational = Teaching a skill, system, or concept
   - Inspirational = Motivating, storytelling, perspective-shifting
   - Promotional = Selling a product, service, or approach

3. Funnel Stage: [Awareness / Consideration / Decision]
   - Awareness = Introducing new concepts, building understanding
   - Consideration = Comparing approaches, evaluating options
   - Decision = Convincing to take action, addressing objections

4. Format: [How-to / Framework / Case Study / Opinion]
   - How-to = Step-by-step instructions
   - Framework = Mental model or thinking system
   - Case Study = Real example with results/story
   - Opinion = Point of view, hot take, or controversial stance

5. Platform: [Blog / Substack / LinkedIn / Twitter / Video / Podcast / Other]

Output as a table I can copy into Google Sheets:
Title | Cognitive Load | Intent | Funnel Stage | Format | Platform

Content Library:
[Paste your content list here]
Copy the output table directly into a new Google Sheet. This becomes your analyzed content library.
The goal is to enable pattern analysis by content type. You need to be able to ask: “How do my tactical how-tos perform compared to my strategic frameworks?” and actually get an answer.
Step 2: Analyzing performance patterns
Export performance data for all your published content: publish date/time, engagement metrics (views, clicks, shares, time on page), and the taxonomy tags you just created.
Make sure your export includes:
Content title
Publish date and time
Platform
Performance metrics (pick 1-2 primary metrics: views, clicks, engagement rate, time on page)
All 5 taxonomy tags from Step 1
Now feed this to Claude or GPT-4 with this prompt:
I’m providing performance data for [X] pieces of content published over [timeframe].

Each piece is tagged with: cognitive load (tactical/strategic), intent (educational/inspirational/promotional), funnel stage (awareness/consideration/decision), and format (how-to/framework/case study/opinion).

Analyze performance patterns by content type and timing.

For each content type category, identify:

1. Days of week with highest engagement (and lowest)

2. Times of day with highest engagement (and lowest)

3. Months or quarters with highest engagement patterns

4. Any correlations with external timing factors: start/end of month, start/end of quarter, major industry events, holiday periods

5. Platform-specific patterns: Do timing patterns vary by distribution channel?
   - Compare: LinkedIn posts vs. email newsletters vs. blog content vs. Twitter threads
   - Look for: Platform-specific optimal days/times
   - Example: “Tactical how-tos perform 2.4x on LinkedIn Tue-Thu mornings, but 1.8x via email on Monday mornings”

Look for statistically meaningful patterns, not random variance. Focus on patterns that repeat across multiple examples.

[Paste your content performance data]
When I ran this analysis for Yahini’s content (my strategy-first content ops tool), I discovered that our tactical implementation guides (step-by-step workflows for using AI to generate keyword strategies and content briefs) performed 2.8x better in the first two weeks of each quarter. Meanwhile, our strategic positioning pieces about building content systems and choosing frameworks crushed (3.7x baseline) in the final three weeks of quarters.
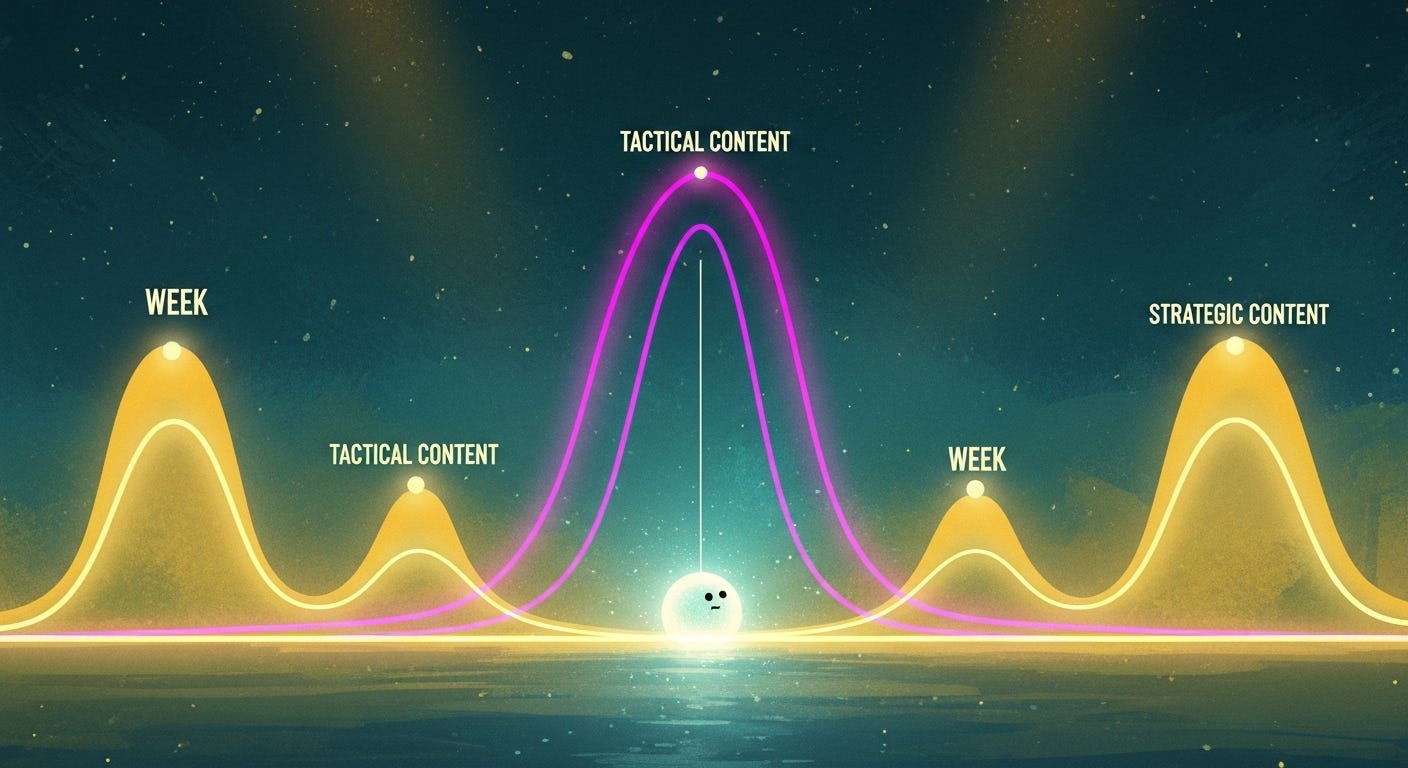
I had absolutely no idea this pattern existed until AI surfaced it. Turns out content marketers (our audience) are in execution mode at quarter starts (”I need to ship content NOW”) and planning mode at quarter ends (”I need to figure out our content strategy for next quarter”).
Makes perfect sense in retrospect, but I’d been publishing randomly across both windows for months, leaving performance on the table.
Step 2.5: Validating causality
Before building your receptivity calendar, validate that timing patterns actually CAUSE performance differences.
Here’s where we channel our inner Karl Popper 👨🔬 - the philosopher of science taught us that real knowledge comes from falsification. You need to actively try to disprove your patterns before you trust them.
The problem is: Your Step 2 analysis might show “strategic frameworks perform 3.7x better in final weeks of quarters.” But what if you also published your highest-quality strategic content at quarter-end, or covered more timely topics during planning season, or had audience growth that skewed recent data?
You could be optimizing for patterns that don’t actually work.
Starting with limited data is fine. If you only have 24 pieces of content annually, you’ll identify 2-3 early hypotheses, not a complete receptivity map. That’s enough to make smarter timing decisions than “post every Tuesday.” Your calendar becomes more sophisticated as your library grows.
Here is a validation prompt to use:
I’ve identified timing patterns in my content performance. Before building a scheduling system around these patterns, validate whether timing is CAUSING performance differences or if confounding variables explain the results.

For each pattern below, analyze:

1. Content quality control: Could quality differences explain this? (Did I publish stronger work during high-performance windows?)

2. Topic relevance control: Could topic timing explain this? (Were high-performers on more seasonally relevant topics?)

3. Audience growth control: Could growing audience size explain this? (Was my reach significantly larger during high-performance periods?)

4. External events control: Could non-timing factors explain this? (Product launches, viral moments, press coverage, algorithm changes that coincided with these windows?)

5. Sample size assessment: Is this pattern based on enough examples to be reliable? (Need 8+ examples minimum for medium confidence)

6. Causality verdict: Rate each pattern’s causal confidence:
   - STRONG SIGNAL (10+ examples): Trust this for scheduling decisions
   - EMERGING PATTERN (5-9 examples): Use as directional guidance, not rigid rules
   - EARLY HYPOTHESIS (2-4 examples): Worth testing, but stay flexible
   - INSUFFICIENT EVIDENCE (1-2 examples): Too few to act on

Identified Patterns from Step 2:
[Paste your timing pattern analysis]

My Context (for confounding variable analysis):
- Audience size at analysis start: [X subscribers/followers]
- Audience size at analysis end: [Y subscribers/followers]
- Growth rate: [% growth over period]
- Major external events during period: [product launches, rebrand, viral posts, press coverage, algorithm changes]
- Content quality changes: [Did you hire writers, change creation process, improve over time?]
- Platform changes: [Any distribution channel shifts?]

Output format:
Pattern | Causality Rating | Confounding Variables Detected | Keep for Calendar? (Yes/No/Test Further)
You’re looking for patterns rated “high Causality” or “Medium Causality” with minimal confounding variables. These are the patterns that make it into your receptivity calendar.
Methodology Disclaimer: AI can identify obvious confounders (audience growth, topic seasonality, sample size issues) but cannot detect invisible factors like sentiment shifts, competitor moves, or algorithm changes you didn’t document. Treat causality ratings as informed hypotheses, not statistical proof.

Before we build the next three steps of the system, you need to understand a concept that will prevent the single biggest timing failure most content teams make.
It’s called Noble Cause Corruption and it comes from law enforcement ethics research. It describes what happens when people compromise their principles in pursuit of what they believe is a righteous goal.
The classic example: detectives who cut corners on evidence procedures because they’re certain they’ve caught the right suspect. The goal (justice) feels so important that the method (due process) becomes negotiable.
Here’s how this applies to your content timing strategy: Teams sacrifice strategic timing because “consistency” feels like the responsible choice. So you publish mediocre content at suboptimal times rather than wait for the right cognitive window. The commitment to consistency becomes more important than the strategy it was meant to serve.
The stakes aren’t equivalent. You’re not planting evidence, you’re just publishing at the wrong time... But the psychological trap is identical: prioritizing the appearance of discipline over actual results.
Now let’s build the rest of the system.

Step 3: Building a “Receptivity” calendar
Now it’s time to transform your pattern analysis into a strategic scheduling guide: a “receptivity calendar” that shows when your audience is most receptive to each content type.
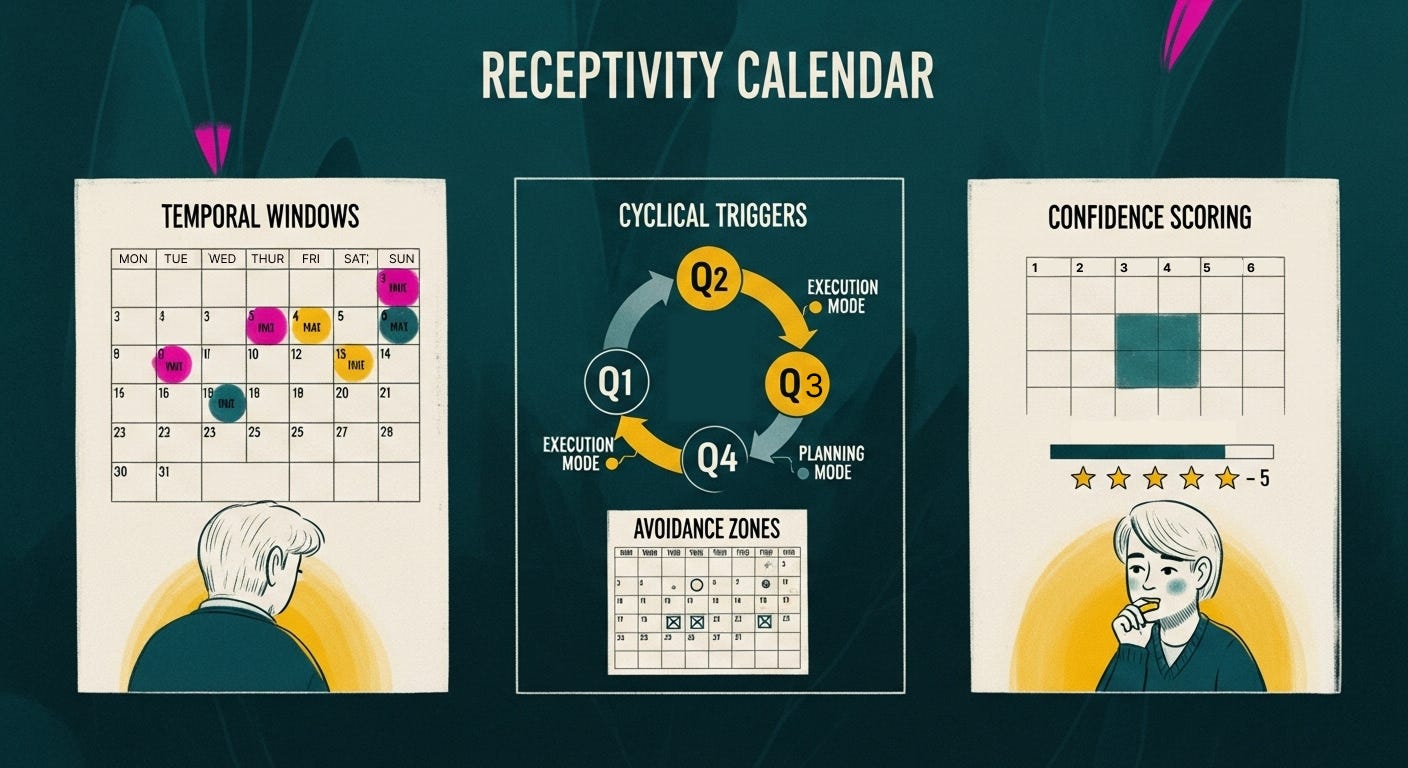
Take your AI analysis from Step 2 and build out four dimensions for each content type:
Dimension 1 ➳ Temporal Windows
Identify the specific timing patterns (days, times) when this content type performs above baseline.
Note the performance differential: “Tuesday 8-10 AM performs 2.3x baseline, Wednesday 9-11 AM performs 1.8x baseline, Friday afternoon performs 0.4x baseline.”
Dimension 2 ➳ Cyclical Triggers
Map the recurring external events that create receptivity spikes. These are predictable moments when your audience enters specific cognitive states. Think of them as the high and low tides of attention:
Quarter boundaries: First two weeks of Q1/Q2/Q3/Q4 = execution mode. Last three weeks = planning mode.
Month boundaries: First week = fresh start energy, budget availability. Last week = reporting mode, results focus.
Industry events: 2-3 weeks before major conferences = research mode (case studies perform well). Week of conference = attention elsewhere (avoid). Week after = implementation mode (tactical content spikes).
Economic cycles: Tax season, budget planning season, fiscal year-end—these create predictable attention shifts in your audience.
Dimension 3 ➳ Content-Specific Avoidance Zones
This is the inverse map: when to actively NOT publish certain content types. They’re essentially moments when publishing actively damages your positioning (the equivalent of showing up to a funeral in beach attire…):
Tactical how-tos during holiday weeks (people aren’t in implementation mode, so publishing makes you look tone-deaf)
Promotional content the week before your industry’s major annual event (attention is elsewhere; you look mega desperate)
Strategic frameworks mid-quarter (execution mode dominates and strategic thinking feels like a distraction)
Mark these as hard avoidance zones.
The Noble Cause of “we need to post something this week” will tempt you to fill these slots. Don’t. Silence during an avoidance zone performs better than content published at the wrong cognitive moment.
Dimension 4 ➳ Confidence Scoring
Rate each pattern’s reliability on a 1-5 scale based on sample size and consistency:
5 = High confidence: Pattern repeated across 10+ examples with consistent results
3 = Moderate confidence: Pattern visible in 5-9 examples, some variance
1 = Low confidence: Pattern suggested by 2-4 examples, needs more data
This prevents you from over-optimizing for patterns that might be noise. If your “strategic frameworks perform best on Mondays” pattern has a confidence score of 2, don’t rigidly schedule all frameworks for Mondays, but instead treat it as a hypothesis to test, not a law to follow.
Now let AI build the calendar structure automatically:
Using my validated timing patterns, create a complete receptivity calendar in the 4-dimension format.

For EACH content type in my taxonomy (tactical how-tos, strategic frameworks, case studies, opinion pieces, etc.), generate:

**DIMENSION 1 - TEMPORAL WINDOWS:**
- Peak: [day/time] ([X.Xx baseline]) [Confidence: 1-5]
- Secondary: [day/time] ([X.Xx baseline]) [Confidence: 1-5]
- Avoid: [day/time] ([0.Xx baseline]) [Confidence: 1-5]

**DIMENSION 2 - CYCLICAL TRIGGERS:**
- [Specific recurring events that create receptivity spikes]
- [Include: quarter boundaries, month boundaries, industry events, economic cycles]
- [Provide multiplier for each: e.g., “Quarter starts: 3.1x baseline”]

**DIMENSION 3 - AVOIDANCE ZONES:**
- [Specific periods when publishing this content type damages positioning]
- [Explanation: why this timing creates cognitive state mismatch]

**DIMENSION 4 - CONFIDENCE SCORING:**
Rate each temporal window pattern 1-5:
- 5 = High confidence (10+ examples, consistent results)
- 3 = Moderate confidence (5-9 examples, some variance)
- 1 = Low confidence (2-4 examples, needs more data)

**WHY THIS PATTERN EXISTS:**
[2-3 sentence explanation of the cognitive state or psychological mechanism that drives this timing pattern. What mental mode is the audience in during peak windows vs. avoidance zones?]

**PLATFORM-SPECIFIC NOTES:**
- LinkedIn: [Any LinkedIn-specific timing considerations]
- Blog/Email: [Any blog/email-specific timing considerations]
- [Other platforms I use]

---

My Validated Patterns (from Step 2.5 - High/Medium causality only):
[Paste your filtered pattern analysis]

My Audience Context:
- Industry: [e.g., B2B SaaS, content marketing, AI/tech]
- Primary platforms: [LinkedIn, Blog, Email, etc.]
- Audience role/function: [e.g., content marketers, founders, product managers]
- Geography/timezone: [if relevant]

Format this as structured text I can paste into Tab 1 of my Google Sheet (plain text, clear headers, easy to parse for the scheduling prompt in Step 4).
This generates your complete receptivity calendar in 5 minutes instead of 30-45 minutes of manual work.
Step 4: Building your smart content schedule
Now you’ll build a lightweight AI scheduling assistant that recommends optimal timing for each piece based on your receptivity calendar.
The architecture has two versions:
Version A (15 minutes): Google Sheets + manual copy-paste to Claude (beginner-friendly)
Version B (30-45 minutes): Automated with Make.com (no coding required, runs on autopilot)
Version A: The manual setup (start here)
Create a Google Sheet with three tabs:
Tab 1: Receptivity calendar
Copy your full receptivity map from Step 3. Format as structured text that AI can parse: content type, temporal windows with multipliers, cyclical triggers, avoidance zones, confidence scores
Tab 2: Content queue
Columns: Title | Content Type (dropdown: tactical/strategic/case study/etc.) | Topic | Current Date | Urgency (dropdown: High/Medium/Low) | Status
Tab 3: Scheduling recommendations
Where AI outputs land. Columns: Title | Recommended Date | Recommended Time | Rationale | Performance Multiplier | Override Schedule? (Yes/No
When you create new content, add it to Tab 2. Copy the row data, paste into the prompt below, get timing recommendation from Claude, paste result into Tab 3.
The Strategic Friction Prompt
Here’s where we build in what
calls “pause.” In his piece ‘Why AI Answers Too Fast for Us to Think,’ Sam argues that instant AI answers remove the friction that creates real understanding. Speed looks like intelligence, but insight happens in the hesitation.
So, force the AI to ask you a clarifying question before giving recommendations. This 10-second pause often reveals whether you should optimize for immediate timing (catching a trend) or cyclical timing (waiting for the right cognitive season).
Use this prompt:
Before providing timing recommendations, ask me ONE clarifying question about this content that would significantly improve scheduling accuracy.

Then wait for my answer before proceeding.

After I answer, provide optimal publish timing.

Content Details:
- Title: [X]
- Content Type: [tactical how-to/strategic framework/case study/etc.]
- Topic: [Y]
- Current Date: [today’s date]
- Urgency: [High/Medium/Low]
- Platform: [LinkedIn/Blog/Email/Twitter/etc.]

Receptivity Calendar Reference:
[Paste the specific content type section from Tab 1]

After I answer your clarifying question, complete these tasks:

1. Identify the next 3 optimal timing windows in the next 30 days
2. For each window, provide: specific date/time, expected performance multiplier, and rationale
3. Note any cyclical triggers or avoidance zones that apply
4. If High urgency, recommend “good enough” timing that doesn’t sacrifice more than 30% performance vs. optimal
5. Specify whether recommended timing conflicts with a typical “regular schedule” (e.g., “every Tuesday”) and explain why strategic timing should override

Output format: Structured table I can paste directly into Tab 3
Version B: The automated setup (upgrade)
Once you’re comfortable with the manual workflow, automate it with Make.com (free for up to 1,000 operations/month).
The automation flow:
You add a new row to Tab 2 (Content Queue)
Make.com detects the new row
Make.com sends your prompt + content details + receptivity calendar to Claude API
Claude asks its clarifying question
Make.com emails you the question
You reply with your answer
Make.com sends your answer back to Claude
Claude generates timing recommendations
Make.com writes results to Tab 3 (Scheduling Recommendations)
Setup instructions (no coding required):
Step 1: Sign up for Make.com (free tier works)
Step 2: Create a new scenario with these modules:
Trigger: Google Sheets → Watch New Rows (connects to your Tab 2)
Action: OpenRouter API → Create Chat Completion (cheaper Claude access)
API Key: Get from openrouter.ai ($5 credit is ~500 requests)
Model: anthropic/claude-3.5-sonnet (or, 4.5)
System Message: “You are a content timing strategist. Always ask ONE clarifying question before giving recommendations.”
User Message: [Map fields from your Sheet row + paste your Receptivity Calendar]
Action: Gmail → Send Email (sends Claude’s question to you)
Pause: Wait for Email Reply (Make.com waits for your response)
Action: OpenRouter API → Create Chat Completion (sends your answer back to Claude)
Action: Google Sheets → Add Row (writes Claude’s recommendations to Tab 3)
Step 3: Turn on the scenario. Now every time you add content to Tab 2, the automation runs. Your calendar becomes self-aware.
Step 5: The refinement loop (optional, but worth it)
Once you start publishing with AI timing recommendations, feed the results back into the system.
This is optional - the workflow works fine without it - but if you want the receptivity calendar to get smarter over time, this takes 10 minutes per month.
Pull your last 30 days of published content. Compare actual performance against the predicted multipliers. Then ask Claude or GPT-4:
Performance feedback for receptivity calendar refinement.

Published Content Results:
- Content Type: [X]
- Recommended Timing: [Y] (predicted multiplier: 2.4x)
- Actual Performance: [Z% vs. category baseline]
- Date Published: [date]

[Repeat for 5-10 recent pieces]

Questions:
1. Which timing patterns are proving accurate? (Increase confidence scores)
2. Which patterns aren’t holding up? (Decrease confidence scores or remove)
3. Are any new patterns emerging that I should add to the calendar?
4. Any external factors (industry changes, audience growth, economic shifts) that might be changing receptivity patterns?

Keep recommendations specific and actionable.What you’ve actually built (and why it’s defensible)
Your timing intelligence system is complete.
Here’s the complete architecture:
A systematic way to categorize content by cognitive load required (Step 1)
identify when your audience is in each cognitive state through performance pattern analysis (Step 2)
validate that timing actually causes performance differences vs. confounding variables (Step 2.5)
map validated patterns into a predictive receptivity calendar (Step 3)
deploy AI-powered scheduling that optimizes for cognitive availability instead of mechanical consistency (Step 4)
and continuously refine as your audience’s patterns evolve (Step 5).
You’ve built something most content strategists never develop: A systematic understanding of when your audience’s cognitive resources are available versus depleted. When they’re in execution mode versus reflection mode. When they’re receptive to tactical implementation versus strategic frameworks.
Your competitors can’t steal this advantage because it’s built from your proprietary performance data, your specific audience composition and your unique content taxonomy. They can copy the methodology, but they can’t copy your calendar. It takes months of published content and systematic analysis to build.
Now… Reply with one timing mystery from your content: Something that performs way better or way worse at specific times, and you have no idea why. Let’s see if the cognitive seasons framework cracks it.
To catching your audience in the right season,
Chief 🤖 at ROBOTS ATE MY HOMEWORK
📚 Enjoyed this deep dive into timing intelligence? Here are more AI workflows that refuse to be boring:


This sounds a lot like having a job...
So much value here, Mia, great article